Asylum policy

The Commission’s plan for reforming EU asylum policy is very ambitious. But can it work?


The European Commission announced last Wednesday a new package of proposals designed to reform the EU asylum system. The proposals include compulsory redistribution of asylum applications among the EU member states. This is called ‘corrective allocation mechanism’ or ‘fairness mechanism’.

Countries would be allocated ‘reference shares’ of asylum applications, and the moment a country’s reference share is exceeded by 50%, an automatic system will set it that will send the excess asylum applicants to countries that have not attained their reference shares yet. If member states do not cooperate, they will have to pay a ‘solidarity contribution’ of €250,000 for every asylum application they refuse to process.

The proposal for compulsory redistribution backed by the threat of financial penalties (sorry, solidarity contributions) is very ambitious. But can it work? And I mean, can it work in a strictly technical sense, provided that the EU musters the political support to adopt the proposals[1], manages to make the member states comply with the rules, ensures that they don’t game the national asylum statistics, and so on – additional problems that are by no means trivial to solve. Let’s also leave aside for the moment the normative issue whether such a compulsory redistribution system is fair, to asylum seekers and to the EU member states. For now, the simpler question – can the system work even in the best of political and bureaucratic circumstances?

How is the system supposed to work?

This is how the system is supposed to work, or at least how I think it’s supposed to work, based on the available explanations (see here, here, here and the actual draft regulation here):

(1) Each country gets a ‘reference key’ based on the relative size of its population and the relative size of its GDP (the two factors weighted equally) compared to the EU totals. For example, in 2014 Germany had a population of 81,174,000 (16% of the EU population of 508,191,116) and a GDP of €2,915,650 million (21% of the EU GDP of €13,959,741 million[2]), which, when combined, make up for a reference key of 18.5%.

(2) This reference key is translated into reference shares (indicative shares of the total number of asylum applications[3] made in the EU that each member state is expected to receive) by multiplying the reference key with the total numbers of asylum applications registered in the EU in the preceding 12 months. For example, according to Eurostat[4], between 1 January 2014 and 31 December 2014 the total number of asylum applications received in the EU was 653,885, so Germany’s reference share for January 2015 (covering the period 1 February 2014 – 31 January 2015) would be 18.5% of 653,885 which equals 120,969 applications.

(3) If a member state receives a number of applications that exceeds by 50% its reference share, the excess applications are to be redistributed to member states that have not attained their reference shares yet. For example, Germany would have to receive more than 181,453 (150% of 120,969) applications during the current and preceding 11 months to trigger the relocation mechanism.

(4) The reference totals and references shares are updated constantly and automatically.

How would the system work if it had to be implemented at the end of 2015 already?

Let’s first do the simple arithmetics to see how the system would work if it had to enter into force in the last month of 2015. We can plug in the total number of asylum applications registered in the preceding 12 months (hence, between 1 December 2014 and 30 November 2015) to calculate the country’s reference shares. We can then see who did more and who did less than their fair (reference) share, and we can estimate the number of transfers that would be necessary to balance the system.

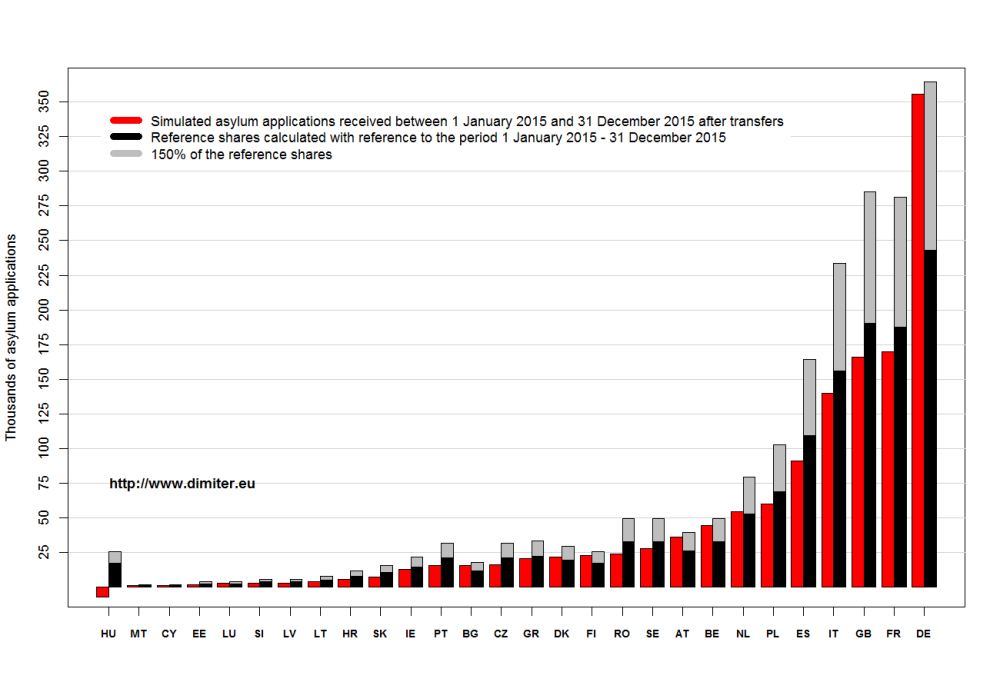
According to Eurostat, the total number of asylum applications received in the reference period was 1,281,560, so this number is used in the calculations that follow. The figure below shows the reference shares (in black), 150% of the reference shares (in grey) and the actual numbers of applications received during the entire 2015 (in red). We can see that Hungary, Sweden, Germany, Austria, Finland, Bulgaria, and Cyprus would have exceeded 150% of their reference shares. And between them they would have had 449,821 ‘excess’ applications for redistribution. All the other member states are potential recipients (with the exception of Belgium, Denmark, and Malta which have received numbers of applications exceeding their reference shares but with less than 50%). The total number of available ‘slots’ for transfer is 592,469. The UK has 145,750, France has 106,227, Spain has 91,589, Italy has 67,689, Poland has 54,456, and so on. Even Greece would have to accept 8,577 more applications to achieve its fair share of registered asylum applications[5].

asylum_application_and quotas12

To sum up, if the ‘fairness mechanism’ was to enter into force in December 2015, it would require the relocation of almost half a million asylum seekers across the continent, with some member states having to receive more than 100,000 additional applications to balance the system. More than one-third of all applications received in the EU during the preceding 12 months would have to be relocated.

If the UK[6], for example, would refuse to accept the additional asylum applications to fill up its reference share, it would be expected to pay ‘solidarity contributions’ to a maximum of €36,437,500,000 (more than 36 billion euros). (For comparison, the total gross UK contribution to the EU budget in 2015 was around €16 billion). The total pool of asylum applications to be relocated would be worth  €112,455,250,000 (that is, more than 112 billion euros)! For comparison, the total budget of the EU for 2015 was € 141.2 billion.

To my mind, the scale of the potential fines (sorry, ‘solidarity contributions’) is so big as to make their application totally unrealistic. Of course, it is the threat of fines that is supposed to make the member states cooperate, but to do their work, fines still have to realistic enough.

To sum up the argument so far, things don’t look very bright for the solidarity mechanism. But one might object that 2015 was exceptional, and that it is precisely this type of imbalances observed at the end of 2015 that the fairness mechanism is designed to avoid. Yet, unless the system starts with a clean slate[7], the existing imbalances accumulated over the past months would have to be corrected somehow. The analysis above shows the enormous scale of the corrections needed, if the system would have entered into force five months ago.

How would the system handle the 2015 flow of asylum applications?

We can also try to simulate how the fairness mechanism with compulsory reallocation would have handled the flow of asylum applications that the EU experienced during 2015 (provided that the member states cooperated fully). That is, we start with the situation as observed in January 2015, we calculate the reference shares and apply the necessary transfers to balance the system, and then we move forward to February 2015 observing the actual numbers of applications received in reality, balance the system again with the necessary transfers, and so on until the end of the year. (The script for the analysis and the simulation (in R) is available upon request.)

Running the simulation for the entire course of 2015 delivers good news and bad news (for the architects of the proposed mechanism). The good news is that the redistribution system does not get ‘choked up’ – that is, it does not run out of capacity to redistribute asylum applications received by some member states in excess of 150% of their reference shares to member states that have yet to reach their reference shares. The bad news is that in order to get and stay balanced, the system applying the ‘fairness mechanism’ needs to make approximately 500,000 transfers (that makes 37% of all asylum applications received in the EU during the year).

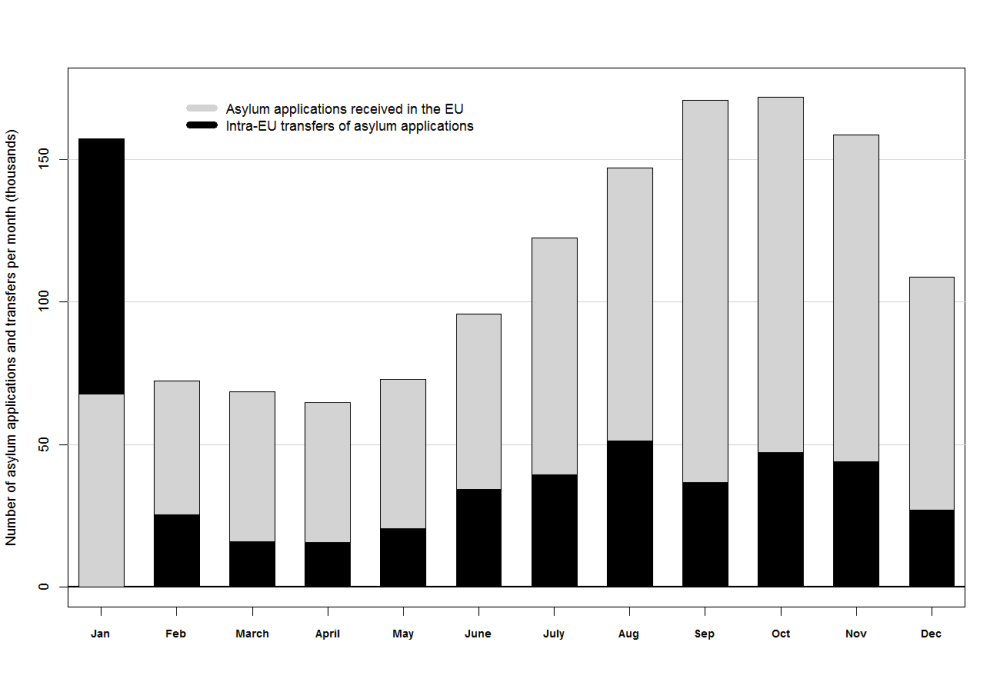
The figure below shows the number of transfers (in black) that need to be made per month, together with the actual number of asylum applications received in the EU as a whole during this period (in grey). Approximately 157,000 transfers must be made in the first month of the simulation (January 2015) to balance the system initially, and the remaining 343,000 are needed to keep it in balance for the rest of the year. The peak is in August, when more than 50,000 transfers must be made. (The bars are not stacked upon each other but overlap).

asylum_application_transfersmonthly2015

The next figure shows the distribution of transfers per member state. The blue bars that go below the horizontal line at zero indicate that the member state is a net ‘exporter’ of asylum applications, and the red ones that rise above the zero line indicate that the member state is a net receiver of transferred applications during the year, according to the simulation. (The parts of the bars colored in light blue and light red show the transfers made in the first month of the simulation.)

It is clear from the figure that Hungary, Sweden, Germany and Austria export the greatest number of applications, while Poland, Italy, Spain, France and the UK are expected to receive the most transfers. Some countries actually change their status in the course of the year from exporters to receivers of additional asylum applications (Denmark) and vice versa (Finland). Even Sweden and Hungary – countries that are big net exporters for most of the year have to receive additional applications during one or two months (see here the detailed plot of the experience of individual countries over the 12 months of the simulation).asylum_application_transfers2015

Despite the huge amount of transfers, not all member states handle a completely proportional burden of the total EU pool of asylum applications throughout the year. While the monthly transfers correct for gross imbalances and ensure that no country deals with more than 150% of its reference share, the system still leaves potential for significant differences across the member states. The figure below demonstrates this fact by showing the simulated number of asylum applications in red (actual applications received and simulated transfers) and the references shares (in black and grey). While the two sets of bars are much closer now, and the red one does not exceed the grey one for any country, member states still vary from fulfilling 70% of their reference shares (for example, Croatia, Portugal, Romania, and Slovakia) to fulfilling close to 150% of their reference shares (Germany, Belgium and Austria).[8]

asylum_application_sims_and quotas

Conclusions

To sum up, the proposed compulsory redistribution of asylum applications among the EU member states can reduce the current imbalances, but only at the price of a huge amount of transfers between the member states. With the proposed parameters, the mechanism would be able to handle even a great influx of asylum seekers as the one observed during 2015. However, under the 2015 scenario, half a million applications would have to be redistributed to make it work. An enormous amount of transfers between member states would be necessary to balance the system initially (unless the mechanism starts with a clean slate), and as many as 50,000 applications per month might have to be redistributed later (under a scenario similar to the one that actually occurred in 2015).

The reference period of 12 months used for calculating the countries’ reference shares must be updated and moved forward every month to ensure that the system retains enough capacity for redistribution. Otherwise, the ‘cushion’ provided by the fact that countries only export applications once they receive 50% more than their reference shares might not be enough to guarantee that there are enough ‘free slots’ in other member states. For the reference period to be updated fast, reliable and almost instantaneous information about the flows of asylum seekers to all member states must be available. Currently, the latest month for which Eurostat has data on the asylum applications received in all EU member states is December 2015: that is,  at the moment, the reference shares can be updated with at least a 4-month lag. This might be too slow to accommodate the rapidly changing flows of asylum seekers to Europe and might quickly grind the fairness mechanism to a halt.

The disadvantage of a relatively short reference period of 12 month that is constantly updated is that some member states might have to receive transferred applications at one point of time and then be eligible to redistribute applications to other countries just a few months afterwards. Such moving around of asylum seekers across the continent is of course highly undesirable, and costly as well.

Although the system might be able to correct the gross imbalances, it might still allow significant differences in the asylum application burden that different EU countries carry to persist. This fact requires attention to the way the ‘excess’ applications are to be distributed among the eligible member states that have not achieved their reference shares yet (since, typically there will be more available slots than requests for redistribution).

Finally, given the scale of required transfers to make the fairness mechanisms work, the size of the proposed penalties (solidarity contributions) for refusing additional applications is so huge as to be completely unrealistic. If under this mechanism member states are potentially liable for amounts that exceed their total annual contributions to the EU budget, there is little chance they will agree to participate in the mechanism in the first place.

All in all, while in principle the proposed fairness mechanism can work to reduce significantly the imbalances in the distribution of asylum applications across the EU, once the member states realize the amount of additional applications they might have to deal with under this policy, it is highly unlikely they will approve it. And certainly not with the current parameters regarding the reference periods, the references shares or the financial penalties.

Notes

[1] The Polish foreign minister already called the proposals an ‘April Fool’s Day joke.’

[2] The population and GDP estimates are based on statistics provided by Eurostat. GDP is in current prices and comes from the ‘tec00001’ database, in particular.

[3] In addition to asylum applications, the system will also take in to account the number of resettled persons. Eurostat however does not provide monthly data on resettlement. And the (annual) numbers of resettlements relative to asylum applications are so low (less than 1%) that we can ignore them in the analysis without much harm.

[4] The monthly statistics on asylum applications are available in the ‘migr_asyappctzm’ database. The version used in the analysis has been last updated on 6  May 2016

[5] Wait, what? Greece would have to receive more asylum applications? That’s right. Although hundreds of thousands (if not millions) of migrants have arrived on Greek territory in the past year and a half, in 2015 the Greek state has registered as asylum seekers only a negligible proportion of them. So, according to the official statistics (that would be used to run the fairness asylum distribution mechanism), Greece would have to register more applications and would be eligible to receive transfers from other member states until it reaches its fair share. I will leave it to you to judge whether this is a feature or a bug of the proposed system.

[6] The UK and Ireland, by the way, are invited but are not required to join the proposed system, even if the rest of the member states approve it.

[7] From the available documents, it does not seem to be the case that the fairness mechanisms will start with a clean state; that is, with a reference period not extending 12 months back.

[8] Curiously, Hungary appears to have made more transfers than actual applications received during the year according to the simulation, due to the huge fluctuations in the monthly amount of applications registered (which average 20,000 in the first 9 months of the year, but then drop to less than a thousand in the last three) and the moving reference period for calculating the reference shares.

Key numbers

Country
Code
Reference key
Asylum applications 2015
Reference
shares for
2015
Excess/deficit from reference shares for 2015
Excess/deficit from 150% of reference shares for 2015
Transfers to be
made in the course of
2015 (simulation)
Austria AT 2,0% 88.160 25.631 62.529 49.713 -51.796
Belgium BE 2,5% 44.665 32.039 12.626 -3.393 0
Bulgaria BG 0,9% 20.375 11.534 8.841 3.074 -4.676
Croatia HR 0,6% 205 7.689 -7.484 -11.329 5.510
Cyprus CY 0,1% 2.265 1.282 983 343 -850
Czechia CZ 1,6% 1.515 20.505 -18.990 -29.242 14.694
Denmark DK 1,5% 20.940 19.223 1.717 -7.895 1.159
Estonia EE 0,2% 230 2.563 -2.333 -3.615 1.838
Finland FI 1,3% 32.345 16.660 15.685 7.355 -9.319
France FR 14,2% 75.755 181.982 -106.227 -197.217 94.098
Germany DE 18,4% 476.510 235.807 240.703 122.799 -120.770
Great Britain (UK) GB 14,4% 38.795 184.545 -145.750 -238.022 127.292
Greece GR 1,7% 13.210 21.787 -8.577 -19.470 7.408
Hungary HU 1,3% 177.130 16.660 160.470 152.140 -184.043
Ireland IE 1,1% 3.270 14.097 -10.827 -17.876 9.674
Italy IT 11,8% 83.535 151.224 -67.689 -143.301 56.460
Latvia LV 0,3% 335 3.845 -3.510 -5.432 2.756
Lithuania LT 0,4% 320 5.126 -4.806 -7.369 3.674
Luxembourg LU 0,2% 2.505 2.563 -58 -1.340 431
Malta MT 0,1% 1.850 1.282 568 -72 -519
The Netherlands NL 4,0% 44.975 51.262 -6.287 -31.919 9.498
Poland PL 5,2% 12.185 66.641 -54.456 -87.777 47.751
Portugal PT 1,6% 900 20.505 -19.605 -29.857 14.694
Romania RO 2,5% 1.255 32.039 -30.784 -46.803 22.958
Slovakia SK 0,8% 325 10.252 -9.927 -15.054 7.345
Slovenia SI 0,3% 275 3.845 -3.570 -5.492 2.756
Spain ES 8,3% 14.780 106.369 -91.589 -144.774 76.221
Sweden SE 2,5% 162.455 32.039 130.416 114.397 -134.256


Britain, Enlargement, Euroscepticism, Public opinion

Immigration from Central and Eastern Europe fuels support for Eurosceptic parties in the UK

Combining political, demographic and economic data for the local level in the UK, we find that the presence of immigrants from Central and Eastern Europe (CEE) is related to higher voting shares cast for parties with Eurosceptic positions at the 2014 elections for the European Parliament. Evidence across Europe supports the connection between immigration from CEE and the electoral success of anti-Europe and anti-immigration political parties.

Immigration has become the top political issue in the UK. It played a pivotal role during the European Parliament elections in 2014 and it is the most-talked about issue in the build-up to the national elections in 2015.

The arrival of Eastern Europeans in the wake of the ‘Big Bang’ EU enlargement in 2004 and 2007  has a large part of the blame to take for the rising political salience of immigration for the British public. Figure 1 shows that ever since the EU accession of the first post-communist countries in 2004, immigration has been considered one of the two most important issues facing the country by a substantial proportion of British citizens, surpassing even concerns about the economy, except for the period between 2008 and 2012.

Data source: Standard Eurobarometer (59 to 82).

These popular concerns have swiftly made their way into the electoral arena. Some political parties like UKIP and BNP have taken strong positions in favor of restricting immigration and against the process of European integration in general. Others, like the Conservative party, have advocated restricting access of EU immigrants to the British labour market[5] while retaining an ambivalent position towards the EU. Parties with positions supportive of immigration and European integration have altogether tried to dodge the issues for fear of electoral punishment. Arguably, political and media attention to immigration (and East European immigrants in particular) have acted to reinforce the public concerns. In short, British voters care about and fear immigration, and political parties have played to, if not orchestrated, the tune.

But there is more to this story. In recent research we find evidence that higher actual levels of immigration from Central and Eastern Europe (CEE) at the local level in the UK are related to higher shares of the vote cast for Eurosceptic parties at the last European Parliament elections in 2014. In other words, British Eurosceptic parties have received, on average and other things being equal, more votes in localities with higher relative shares of East European residents.

The relationship is not easy to uncover. Looking directly into the correlation between relative local-level CEE immigration population shares and the local vote shares of Eurosceptic parties would be misleading. Immigrants do not settle randomly, but take the economic and social context of the locality into account. At the same time, this local economic and social context is related to the average support for particular parties. For example, local unemployment levels are strongly positively correlated with the  vote share for the Labour party, and the local share of highly educated people is strongly positively correlated with the vote share for the Greens (based on the 2014 EP election results). Therefore, we have to examine the possible link between CEE immigration shares and the vote for Eurosceptic parties net of the effect of the economic and social local contexts which, in technical terms, potentially confound the relationship.

In addition, immigrants themselves can vote at the EP elections and they are more likely to vote for EU-friendly parties. This would tend to attenuate any positive link between the votes of the remaining local residents and support for Eurosceptic parties. Lastly, the available local level immigration statistics track only immigrants who have been in the country longer than three months (as of 27 March 2011). Hence, they miss more recent arrivals, seasonal workers and immigrants who have not been reached by the Census at all. All these complications stack the deck against finding a positive relationship between the local presence of CEE immigrants and the vote for Eurosceptic parties. It is thus even more remarkable that we do observe one.

Figure 2: A scatterplot of the relative share of CEE immigrants from the local population versus the residual share of the vote cast for Eurosceptic parties (UKIP and BNP) at the 2014 EP elections

Figure 2 shows a scatterplot of the logged share of CEE immigrants from the local level population as of 2011 (on the horizontal axis) against the residual share of local level vote shares of Eurosceptic parties (UKIP and BNP) at the 2014 EP election (on the vertical axis). Each dot represents one locality (lower-tier council areas in England and unitary council areas in Wales and Scotland) and the size of the dot is proportional to the number of inhabitants. A few localities are labeled. The voting share is residual of all effects of the local unemployment level, and the relative shares of highly educated people, atheists, and non-Western immigrants in the population. In other words, the vertical axis shows the proportion of the vote for Eurosceptic parties unexplained by other social and economic variables.

The black straight line that best fits all observations is included as a guide to the eye. Its positive slope indicates that, on average, higher shares of CEE immigrants are related with higher Eurosceptic vote shares. Formal statistical tests show that the relationship is unlikely to be due to chance alone.

While the link is discernable from random fluctuations in the data, it is far from deterministic. Some of the localities with the highest relative shares of CEE immigrants, like Brent, have in fact only moderate Eurosceptic vote shares, and some localities with the highest share of the vote cast for Eurosceptic parties, like Hartlepool, have very low registered presence of CEE immigrants. Nevertheless, even if it only holds on average, the relationship remains substantially important.

Does this mean that people born in the UK are more likely to vote for Eurosceptic parties because they have had more contact with East Europeans? Not necessarily. Relationships at the level of individual citizens cannot be inferred from relationships at an aggregate level (otherwise, we would be committing what statisticians call ecological fallacy). In fact, there is plenty of research in psychology and sociology showing that direct and sustained contact with members of an out-group, like immigrants, can decrease prejudice and xenophobic attitudes. But research has also found that the sheer presence of an out-group, especially when direct contact is limited and the public discourse is hostile, can heighten fears and feelings of threat of the host population as well. Both mechanisms for the effect of immigration presence on integration attitudes – the positive one of direct contact and the negative one of outgroup presence – are compatible with the aggregate level relationship that we find. And they could well coexist – for a nice illustration see this article in the Guardian  together with the comments section.

Is it really the local presence of immigrants from Central and Eastern Europe in particular that leads to higher support for Eurosceptic parties? It is difficult to disentangle the effects of CEE immigrants and immigrants from other parts of the world, as their local level shares share are correlated. Yet, the relative share of non-Western immigrants from the local population appears to have a negative association with support for Eurosceptic parties across a range of statistical model specifications, while the effect of CEE immigrants remains positive no matter whether non-Western immigration has been controlled for or not.

There is also evidence for an interaction between the presence of immigrants from CEE and from other parts of the world. The red line in Figure 2 is fitted only to the localities that have lower than the median share of non-western immigrants. It is steeper than the black one which indicates that for these localities the positive effect of CEE immigrants on Eurosceptic votes is actually stronger. The blue line is fitted only to the localities with lower than the median share of non-western immigrants. It is sloping in the other direction which implies that in localities with relatively high shares of immigrants from other parts of the world, the arrival of East Europeans does not increase the vote for Eurosceptic parties.

It is interesting to note the recent statement by UKIP leader Nigel Farage that he prefers immigrants from form former British colonies like Australia and India to East Europeans. Focusing rhetorical attacks on immigrants from CEE in particular fits and makes sense in light of the story told above.

We (with Elitsa Kortenska) also find that CEE immigration increases Euroscepticism at the local level in other countries as well. In a recently published article (ungated pre-print here) we report this effect in the context of the referenda on the ill-fate European Constitution in Spain, France, and The Netherlands in 2005 and on the Treaty of Lisbon in Ireland in 2008. In ongoing work we argue that local level presence of CEE immigrants is systematically related to higher vote shares cast for Eurosceptic parties in Austria, The Netherlands, and France, in addition to the British case discussed in this post.

Why does this all matter? The process of European integration presupposes the right of people to move and work freely within the borders of the Union. This is not only a matter of convenience, but of economic necessity. People from regions experiencing economic hardship must be able to move to other EU regions with growing economies for economic integration to function. In an integrated economy like the EU or the US, a Romanian or a Greek must be free to seek employment in the UK or in Poland the same way an American living in Detroit is able to relocate to California in search of work and fortune.

This is especially true given the lack of large-scale redistribution between EU regions. Economic Integration creates regional inequalities. One way to respond is to redistribute the benefits of integration. Another is to allow people and workers to move where employment chances are currently high. If none of these mechanisms is available, economic and political integration are doomed. Therefore, if immigration within the EU indeed fuels Euroscepticism, as our study suggests, the entire European integration project is at risk.

European Parliament, Future of the EU, the Netherlands

Debating the European Parliament is possible

DSC_1969

On 6 June, in the municipal house of the city of The Hague, a roundtable debate took place, entitled ‘Towards a new parliament? The European Parliament after the 2014 elections‘. The invited speakers featured both prominent academics like Christophe Crombez (Stanford University/University of Leuven) and Claes de Vrees (Univeristy of Amsterdam), politicians like Wim van de Camp (a Member of the European Parliament from the Christian Democrats), and the expert Tom de Bruijn (former Permanent Representative of the Netherlands to the EU and current member of the Dutch Council of State, also an external teaching Fellow at the Institute of Public Administration). The debate was organized by the Institute of Public Administration of Leiden University and the Standing Group of the European Union of the European Consortium for Political Science Research (ECPR) with the support of the European Commission Representation to the Netherlands, the Dutch Minisitry of Foreign Affairs and the Hague municipality which co-sponsored the debate. The roundtable took place in the large atrium of the municipality, while somewhere upstairs negotiations on the new city government were still under way.

DSC_1882

Most of the public were academics – the debate was part of the 7th Pan-European Conference on the EU – but, quite amazingly, people from all walks of life showed up as well – from secondary school students to journalists to retired civil servants. If anything, the full hall and lively discussion showed that debating the future of Europe with a broader public is not only necessary, but also possible.

DSC_1888

The moderator, Joop Hazenberg, asked a number of questions about the speakers’ assessment of the results of the European Parliament elections, their vision of the future priorities and the future President of the Commission. Then there were questions from the floor.

DSC_1931

Two of the speakers – Crombez and de Vreese were more positive than many may have expected on the entry of populist parties in the European parliament, rightly observing that these parties represent views that also have their place and are healthy for the debate. Van de Camp suggested that low turnout in EP elections is the result of lack of education on the EU in secondary schools, a view which was challenged by a member of the audience who was a secondary school pupil.

DSC_1949

De Vreese shared results from his public opinion work which suggest that even more liberal parts of the Dutch electorate are negative towards some member states citizens. This left the audience wondering what the current views and expectations of the Dutch public are with regard to the Internal market.

DSC_1962

Van de Camp was quite optimistic about Dutch companies taking advantage of the final opening of the market for services, yet did not respond to questions on how this would affect the free movement of labour in the Netherlands. De Bruijn highlighted a common energy policy as an urgent priority for Europe. The questions touched on EMU, human rights and the EU, internal market and the selection of the new Commission president. On the latter, the members of the panel were divided: while Crombez felt that making Mr. Juncker the next Commission President would strengthen democracy in the EU, de Brujin pointed out that Mr Juncker was not even on the list of the European People’s Party candidates. With this, a lively debate was finished as one of the highlights of an even livelier conference. This format mixing politicians and academics and using a public venue seems to hold some promise for all involved: academics, politicians, experts and the public.The very exchange of views is creating a better awareness where democracy in the EU is weak and what we can do to change this.

DSC_1952    DSC_1948

Council of the EU

How consensual Council decisions emerge from the coalition-building behaviour of individual governments

This is a guest post by Frank Häge,  Lecturer in Politics at the University of Limerick in Ireland. The post appeared first on the LSE’s EUROPP blog. 


In recent years, media reports about how the EU is trying to tackle the financial crisis often give the impression that EU policy is dictated by a few large member states. This picture is quite a misrepresentation of how the EU actually works. When it comes to the adoption of new laws, the Commission and especially the European Parliament play a significant role in the decision-making process; and decision-making amongst government representatives in the Council is much more equitable than often suggested. In fact, one of the major puzzles about Council decision-making is the high rate of consensual decisions even in areas where the formal rules allow for the adoption of law by a qualified majority of member states. Every year, about 75 to 85 per cent of the Council’s legislative decisions are made without negative votes or abstentions.

A number of explanations have been proposed to account for the high consensus rate of Council decisions. First, consensus might simply reflect common agreement about the desirability of policy change. Second, governments might try to make sure that everybody is ‘on board’ because of concerns about the correct and timely implementation of EU policies at the national level. Third, vote trading between member states across issues or proposals allows the creation of larger compromise packages. Finally, a ‘consensus reflex’ developed as a result of years of Council decisions requiring unanimous consent might still be operating in the Council even though the institutional context that originally required unanimous agreement is not present anymore. Each of these theories is a generally plausible candidate for explaining the high consensus rate. However, all of them have trouble accounting for the lack of change in the consensus rate despite large increases in EU membership size. The big bang enlargement in 2004 increased the preference heterogeneity of member states, so common agreement on policy change should have become less likely. The cost-benefit calculations of bringing everyone ‘on board’ should also have tilted in favour of less accommodation towards recalcitrant member states. Accommodating everyone becomes more costly the more member states there are. Successful exchanges of votes that make all member states better off should have become exponentially more difficult as well. Identifying beneficial vote trades is much easier with 15 than with 25 member states. Finally, informal norms and rules of behaviour that underlie the consensus reflex should have been harder to sustain and enforce after an influx of a large number of uninitiated new member states. In short, based on existing theories, we would have expected the consensus rate to drop after the enlargement in 2004, yet as Figure 1 shows, the empirical record does not bear out this expectation.

Fig. 1   Consensus Decision-Making in the Council of the EU, 1994-2006

In my research, I developed a coalition-building model whose predictions are both consistent with the observed consensus rate and the insensitivity of the rate to changes in membership size over time. I argue that consensus emerges more or less coincidentally from the coalition-building process itself. If the formal rules allow the adoption of Council decisions by qualified majority, member states have an incentive to actively engage in the negotiation process to ensure that they are not marginalized. Government representatives are considered to be boundedly rational actors. Their behaviour is goal-oriented, but in the complex environment of multilateral multi-issue negotiations of the Council, they follow relatively simple heuristics to pursue their policy goals. A plausible heuristic for government representatives is to band together with negotiators from other states with similar positions until their coalition is large enough to formally block a decision. Being part of a blocking coalition ensures that the member state’s views cannot be ignored; and forming those coalitions with like-minded states ensures that policy losses remain relatively small. As a result of this behaviour, larger and larger coalitions form until either one coalition is large enough to ‘unilaterally’ adopt the proposal through a vote, or all member states are organized in two or more blocking coalitions. In the latter case, the agreement of all blocking coalitions is required to adopt the proposal. Thus, in this situation, consensus emerges endogenously as an unintended by-product of the coalition-building behaviour of negotiators who seek to form blocking minority coalitions.

I formalized the theoretical argument in a computational agent-based model and used a case study of the adoption of the Council’s common position on the batteries directive to illustrate the empirical plausibility of its coalition-building dynamics. In the case of the batteries directive, as in many of the model simulation runs, larger and larger coalitions formed over time until the final compromise was in the end brokered amongst a number of blocking minority coalitions. In addition, the assumption of Council negotiators as blocking-minority seekers is supported indirectly by evidence from existing qualitative research, interview studies, and practitioner reports that stress the central importance of coalition-building in the Council negotiation process.

However, the model is not only based on empirically plausible behavioural rules governing the interactions of agents; it is also able to predict the consensus rate in the Council with quite some accuracy. For the three periods with different membership sizes between 1994 and 2006 (12, 15, and 25 member states, respectively), the model predicts consensus rates of 89, 85, and 85 per cent, compared to the observed mean consensus rates over those periods of 75, 82, and 86 per cent, respectively. Furthermore, this prediction accuracy is achieved without taking into account any empirical information about the particular negotiation processes during that period of time. The only changeable parameters of the computational model are the voting threshold and the number of member states. To generate the predictions about the consensus rate, the voting threshold was set to the real-world threshold of 72 per cent and membership size to the respective number of member states during the particular time period. The simulation was then run 1000 times with initial policy positions of actors chosen randomly at the beginning of each run. Note also that the predicted rate is rather insensitive to changes in membership size, although the model was not explicitly designed to reproduce this feature of the observed consensus rate.

Given the good predictive record of the model, I further investigated various ‘if then’ scenarios by varying the number of member states and the size of the majority voting threshold. The findings of those computational experiments further confirm that the model predictions of the consensus rate are relatively insensitive to changes in membership size. In contrast, higher voting thresholds are predicted to significantly increase the consensus rate. If the model is correct, future enlargements of the Union should not have any significant effect on the extent of consensual decision-making. However, the decrease of the voting threshold from 74 to 65 per cent in 2014, as envisaged by the Lisbon treaty, should considerably reduce the number of consensual decisions in the Council.

EU law, History of the EU

The growth and decline of EU legislation over time

Some of the most persistent myths about European integration concern the questions what and how much does the EU do. While the big decisions taken at inter-governmental conferences get all the media attention, day-to-day policy making remains in the shadow, so the public gets a very skewed picture of the daily activities of the EU.

To shed some light on this issue, I developed a presentation of the growth (and decline) of EU legislation over time since 1967.  I gathered all  legal acts (more than 100 000) adopted by the European Communities/European Union and graphed the developments for the last 50+ years. To understand the development of EU legislative productivity one needs to pay attention to the very different types of legal acts the EU can adopt, so the presentation takes this into account and gives a rather detailed view of the data.

The main conclusions one can get from examining the presentation are the following:

1) over the last 15 years the growth in legislative productivity has slowed and even reversed. Currently the EU adopts on average no more rules than during the late 1970s and early 1980s;

2) the decline is productivity is especially pronounced if one looks only at important legislation. Much of the legal output is Commission legislation which is more similar to government and ministerial decrees at the national level and doesn’t have the same importance as real laws.

3) even nowadays, one third of all legal rules adopted concern the agricultural sector.

You are encouraged to look at the entire presentation for details, but the overall picture that appears is hardly one of a union in uncontrolled expansion. Actually, all EU institutions with all their advisory and expert bodies, and all their internal and external consultation committees,  and all their highly-trained bureaucrats and seconded national experts, and all their conferences and conciliation have managed to produce over the last few years a laughably small number of new important legislation.  During the entire 2012 the EU adopted 6 (six) new directives!

Which might actually be a good thing, but please bear this in mind the next time you hear about these faceless bureaucrats in Brussels controlling our lives with their ever-increasing web of rules.

Euroscepticism, Future of the EU, Public opinion

The European Commission vs. the People

The Commission has recently published its vision about the future of European integration. The report is more than ambitious calling for full banking, economic, budgetary and political integration, including ‘dedicated fiscal capacity for the euro area’ which I believe means taxation powers for the EU. Here is the assessment of the Commission about the present state of EU’s legitimacy:

The Lisbon Treaty has perfected the EU’s unique model of supranational democracy, and in principle set an appropriate level of democratic legitimacy in regard of today’s EU competences. ..it would be inaccurate to suggest that insurmountable accountability problems exist. (p.35)

Wow, wait a minute! P e r f e c t e d    the model of supranational democracy?! Appropriate level of democratic legitimacy?! Are the Commissioners living on the same planet as the rest of us? According to data from autumn 2012, fewer than 1 in 3 Europeans said they trust the EU. 60% don’t trust the EU. For only 31% of European citizens the EU ‘conjures’ [sic] a positive image, while for 28% it ‘conjures’ a negative one. In late 2011 only 45% of European expressed satisfaction with the way democracy works in the EU. 43% were not satisfied with the ‘perfected model of supranational democracy’.

And what about the impact of the Lisbon Treaty? Here is a graph of the trust Europeans have in the different EU institutions. By the way, the Commission currently stands at 36% (click to enlarge the graph).

New Picture (1)

The trend is quite clear from a bird’s eye-view, but let’s zoom in on the period after the Lisbon Treaty entered into force:

New Picture

Trust in EU institutions has decreased by more than 20% (from its 2009 levels) so that currently even the directly-elected European Parliament doesn’t get the trust of more than half of the European population. The Lisbon Treaty has perfected things indeed.

Finally, let’s look more specifically at what people think about EU’s expansion into some of the policies mentioned in the report. An absolute majority of Europeans consider that it is only for the national governments to make decisions about public debt (51%), unemployment (58%), social welfare (68%), taxation (68%) and pensions (73%).

If these are not ‘ insurmountable accountability problems’, I don’t know what is. For all its ambition, the Commission offers few answers how the reforms will be pushed through in the face of such strong opposition from the people. There is no way to proceed behind the backs of the citizens, and there is no magic trick to earn their trust overnight. The Commission might be applauded for expressing a bold vision for future Europe, but some reality check is in order.

Europe in the news, Public opinion, Social policy and anti-discrimination

Why EU Commissioners Are Poor Politicians

EU Commissioners might be seasoned bureaucrats but make for lousy politicians. Viviane Reding, currently responsible for Justice, Fundamental Rights and Citizenship, and Commissioner since 1999 (!) is surely a masterful mandarin, but doesn’t play the politics game very well. And by politics, I don’t mean the internal bickering between the Commission, the Council and the European Parliament: I am sure she is a world champion at that – I mean politics as the art of pleasing the public while getting things done. Perhaps after so many years in the Brussels bubble Commissioner Reding has forgotten altogether that pleasing the public is part of the politics game as all. But when public support for the EU is hitting a new low, I can’t help but think that the feelings of the public should be high on the Commissioner’s mind.

In September this year Viviane Reding announced that the Commission is coming up with a proposal to set a compulsory 40-% quota for women on boards of public companies. Immediately, nine countries (including the Netherlands, Sweden and Britain) and a few fellow Commissioners (including several women) expressed very strong disagreement. This, however, was not enough to put the brakes – on 14 November, the Commission approved a watered-down version which ‘sets an objective of a 40% presence of the under-represented sex among non-executive directors of companies listed on stock exchanges’, a “flexi quota” and a statement that ‘given equal qualification, priority shall be given to the under-represented sex’. Now, I haven’t much to say about the quality of the proposal as such – to put my cards on the table, I agree there is a problem with the unequal representation of women on company boards, and I don’t know enough about the effects of quotas to have a strong opinion about the proposed solution.

What is blindingly clear, however, is that the European citizens do not feel that this is an issue for the EU to solve, and there is virtually no popular support for such action coming from Brussels. How do I know? It’s data collected by the EU!

According to Eurobarometer, in 2007 ten percent of the European population agreed that the EU has an important role to play in combating discrimination (page 26, QA11). That’s just one out of every ten Europeans! Only three percent mentioned that they would turn to the EU in case of discrimination at the workplace (p.32, QA 13). In all fairness, 77% said they want to see more women in managerial positions, but no indication they wanted Commissioners poking their nose into that, or a policy which guarantees 40% of these positions for women.

If anything, the case for European involvement into the matter has become even weaker since. A red-hot new survey made available last week shows that only 31% of European citizens agree that there is widespread gender discrimination in their countries:  seven out of ten Europeans find gender discrimination rare or non-existent. Moreover, only 22% agree that being a female puts you at a disadvantage when looking for a job (page 87, QC4). In fact, more people feel that their accent might be a problem. Again, this is not to say that, objectively speaking, there is no underrepresentation of women in top positions. But it seems that the majority of people do not find gender discrimination at the workplace very widespread, nor a political priority.

In 2009 Europeans generally supported measures for monitoring hiring practices and the gender composition at the workforce, but 58% found enough was already being done in that respect. Interestingly, the new survey from 2012 doesn’t even ask people whether they think it’s a good idea for the EU to get involved or whether a ‘compulsory quota’ policy is the way to go. These are quite curious omissions given that the survey is otherwise quite comprehensive and comes out in the same week as the Commission’s policy proposal.

In summary, there is no broad support for further EU action in combating gender discrimination and even less so for a policy of quotas. So why is Viviane Reding pushing this agenda in the face of absent popular support and explicit opposition from national governments? She probably strongly believes that this policy is the right and progressive thing to do. And that the Commission has the obligation to lead rather than blindly follow popular sentiments. But the fact remains that people, and many governments, don’t like the idea.

Irritating an increasingly hostile public with such proposals is not a very smart thing to do because the policy would never be approved by the member states anyways, but you still get the bad press. What is stuck in people’s minds is the fact that the Commission ‘approved’ something that they didn’t like: they won’t remember that the Commission only proposes and the Council and the Parliament decide, and that the initial proposal has been quickly watered-down to a more widely-acceptable version.

That’s why Redding’s recent actions are not smart and politically savvy in the way in which EU-bashing politicians like Nigel Farage are politically smart and savvy. The forefathers of the EU from Jean Monnet to Jacques Delors managed to be both true to their ideals and politically shrewd in order to achieve them.

New policies like women quotas do not win new supporters for European integration. The people who like the idea of positive discrimination are likely to be the people who already support the EU: the more educated, cosmopolitan, and well-off. For the average woman, a position on the board of a top company is equally distant with or without a quota for females. But such policies would alienate people who disagree with the substance of the policy and are already suspicious of the EU. Which, as the numbers show, are by far the majority.

In her term as Information Society and Media Commissioner, Viviane Reding put a lot of effort to increase the visibility of the European Union. Well, now people definitely pay more attention to what the EU does. And they often don’t like it. Now it’s time the Commission starts to pay more attention to what the people have to say.

Educational policy, the Netherlands

Solve for the equilibrium: Dutch higher education

 A bit off-topic but since we have discussed the topic before, here is a re-post from my personal  blog:

1) The number of first-year students in the Netherlands has soared from 105 000 in 2000 to 135 000 in 2011. The 30% increase is a direct result of government policy which links university funding with student numbers. In some programs in the country, student numbers have more than doubled during the last five years. Everyone is encouraged to enter the university system.

2) In the general case, there is no selection at the gate. Students cannot be refused to enter a program.

3) Now, the government’s objectives are to reduce the number of first-year drop-outs  and slash the number of students who do not graduate within four years. Both objectives are being supported by financial incentives and penalties for the universities.

Something’s gotta give. I wonder what…

P.S. ‘Solve for the equilibrium’ is the title of a rubric from Marginal Revolution.

Euroscepticism, Future of the EU

Debating EU’s future with the PVV

Yesterday I gave a talk to political science students for a small symposium on the ‘Future of Europe’. The other speakers were Joop de Kort (professor in Economics) and Auke Zijstra, MEP from the Dutch Freedom Party (PVV). Given that Mr. Zijstra is mostly famous for defending the PVV website for complaints against East Europeans, and given the PVV’ s  position for Dutch EU-exit, you might expect that the debate turned ugly. But in fact the discussion was rather interesting and definitely civilized.

The main point on which I and Mr. Zijstra couldn’t agree was the power and responsibility of the Commission. We agree that the not all decisions that the EU has taken have been necessary and appropriate. But while he blames mostly the Commission, ‘Brussels’, and the bureaucrats, I think that since it is the Council (and the European Parliament) that co-decide in Europe, they should take the blame or the credit for the EU decisions. The Commission only proposes, and in the vast majority of cases it is the member states governments which decide! So it seems rather preposterous to suggest that ‘Brussels’ has made a decision while it is the signatures of the national governments that appear on the final document. Of course, the myth that the faceless unelected bureaucrats decide on our behalf in Brussels is extremely popular, but precisely for this reason it should be debunked on every possible occasion! It is national civil servants who discuss the Commission proposals in the Council’s working groups, it is national ambassadors who negotiate the proposals in COREPER, and it is national ministers who ultimately decide in the meetings of the Council.

Obviously, it makes political sense to shift the blame to ‘Brussels’ for decisions unpopular at home. But this political ‘strategy’ erodes the little trust normal people have in the institutions of the EU.

As for the a country’s possible exit from the EU, I am rather pragmatic about the issue and don’t feel that such a perspective shouldn’t be discussed. The problems I see, however, are two. First, even if you exit the EU but still want to participate in the Internal Market, you still have to apply the bulk of EU legislation (ask Norway) and you might need to pay to access the markets (ask Switzerland). Second, being out of the EU while the EU still exists might be a better option than being in the EU, but there is no guarantee that once you exit, the other countries would not follow. And most ‘pragmatic’ Euroskeptics would agree that a world without the EU (no single market, no freedoms to travel and trade, etc) is worse than a world in which the EU, even if imperfect, exists. So, free-riding on the integration efforts of others might be a myopically rational national strategy, but it would lead to the unraveling of the whole EU project, leading to a collective outcome that none wished for.

Here is a link to my presentation for the symposium. It might seem a bit cryptic without the narration but, hey, it’s another Prezi beauty.